
Importing Data
GPX Files
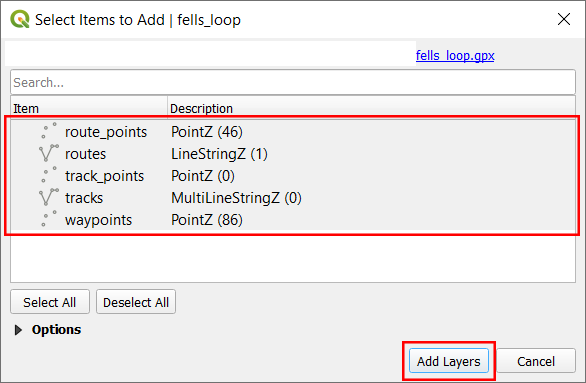
- Drag and drop the .gpx file into the map layer.
- Select the point layer (or layers desired) in the popup.
Spreadsheet with latitude and longitude data (decimal degrees, dms)
- In the spreadsheet software, save the sheet as as CSV (comma-separated variable) file. The resulting file should have a .csv file extension.
- For example, in Excel, navigate to File > Save As and select “CSV (Comma delimited) (*.csv)” in the drop down box, and then click Save.
- In QGIS, select “Open Data Source Manager”
 in the toolbar (or go through Layer > Open Data Source Manager).
 - In the window that opens, click on “Delimited Text” in the sidebar, and then on the three dots by the “File name” row and select the exported file.
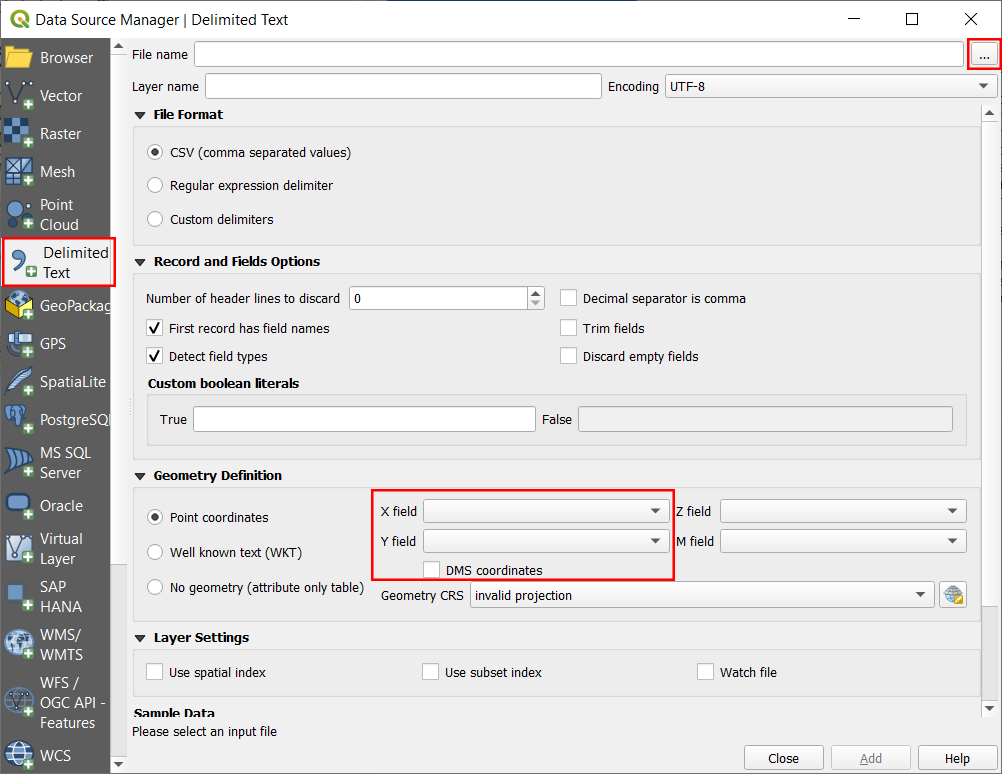
- In the X-field select the column header corresponding to the longitude in your data, and for the Y field, select the header for latitude. Check the DMS coordinates box if your coordinates are in degree-minute-second format, and then select an appropriate CRS by clicking the small globe icon.
- Once all adjustments have been made, click Add, and a layer containing the points should be added onto the map.
LiDAR Data
- Drag and drop the LiDAR .laz or .las file into the QGIS window and select the layers to import.
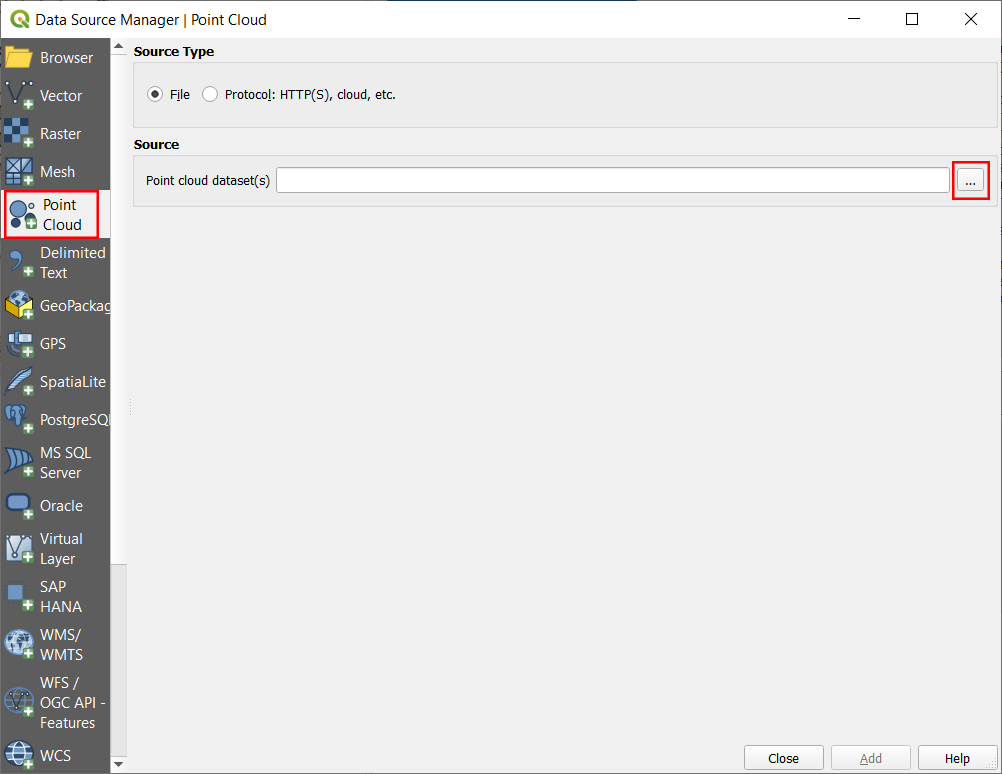
- Alternatively, open the Data Source Manager as before and click on “Point Cloud” in the left column.
- Then, click on the three dots, navigate to your LiDAR file and then click Add. Select the point layers you wish to import.
Importing Polylines and Polygons
- If your lines or polygons are in a shapefile (.shp), drag and drop the shapefile (.shp) containing the lines or polygons into the QGIS window. If they are saved in a GeoPackage (.gpkg), drag and drop it into the QGIS window and then select the relevant layers to be imported.
- Alternatively, open the Data Source Manager , click on “Vector” in the leftmost column and select and add your files there.
Joining Points Together
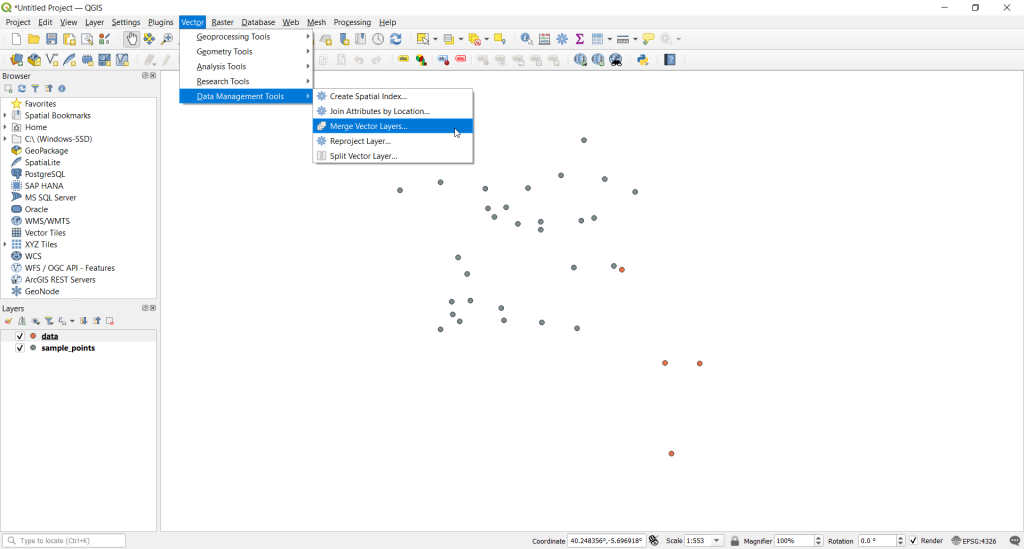
- Import the point layers to be merged into QGIS, and ensure that they are of the same geometry type (i.e. Point, MultiPoint, LineString, Polygon)
- Navigate to Vector > Data Management Tools > Merge vector layers.
- In the popup window, first select the layers to be joined with the three dots under “Input layers.”
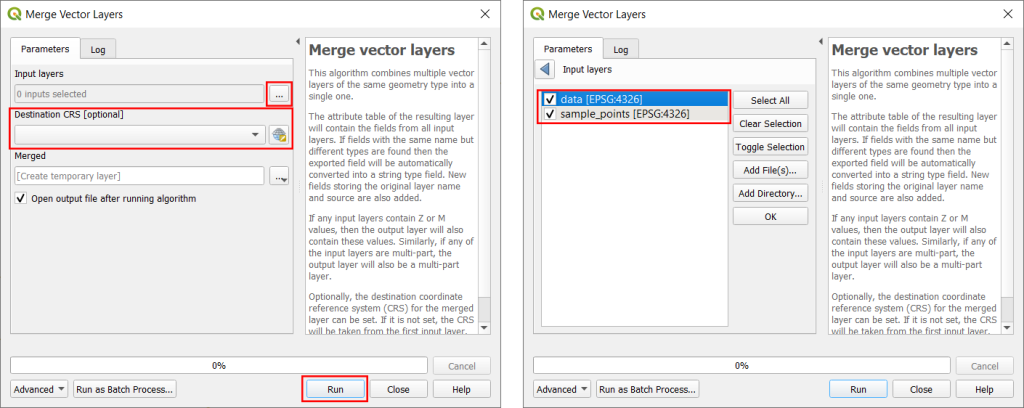
- Then select the appropriate CRS with the dropdown box if it has already been selected in the project, or with the globe icon if it is a new CRS.
- Leave the new filename blank.
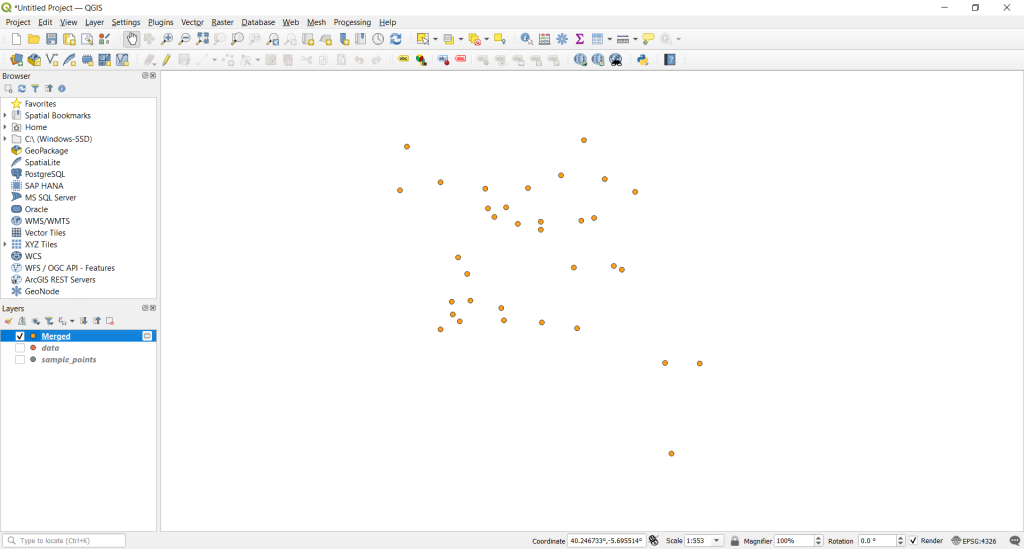
- Click Run. A new layer called “Merged” will have the merged points.
Tracing in QGIS
- Click on the New Shapefile Layer icon
 on the toolbar, or navigate to Layer > Create Layer > New Shapefile Layer. The New Shapefile Layer window should appear.
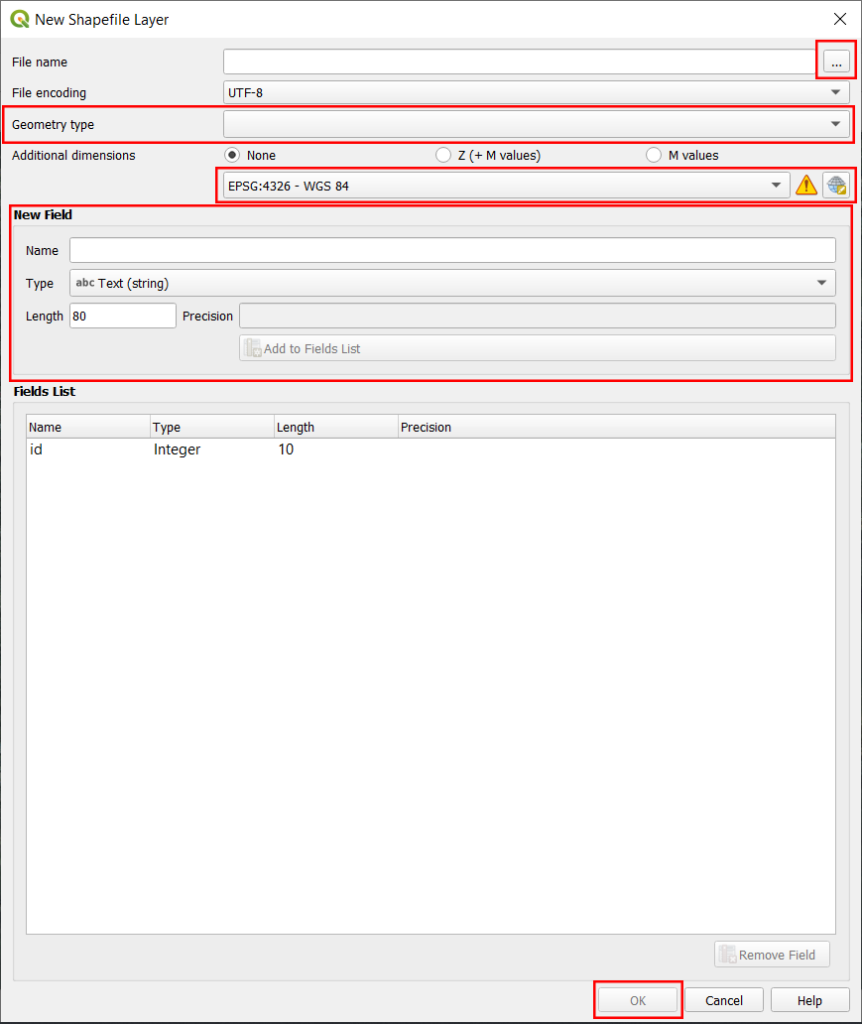
- In the window, first click on the three dots next to “file name” to add a file path for the new layer.
- Then, select the appropriate Geometry type (Polygon for closed shapes, LineString for lines), and the appropriate CRS.
- Under “New Field,” you can add fields for data to be associated with each drawn shape, for example, the name of the traced area. Make sure to select the correct datatype, and then click “Add to Fields List.”
- Click OK.
- A new layer should be visible in the layers list. Select it, then click the Toggle Editing
 icon, or through Layer > Toggle Editing.
 - Then, pan the map to a location you wish to trace and click Add Polygon Feature
 or Add Line Feature
  on the toolbar.
 - While these are selected, you can still zoom in and out with the scroll wheel, and pan by clicking with the scroll-wheel and dragging.
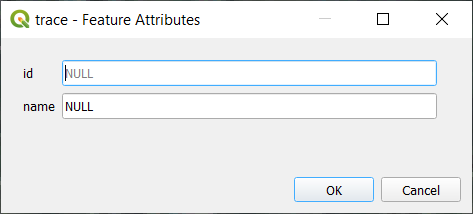
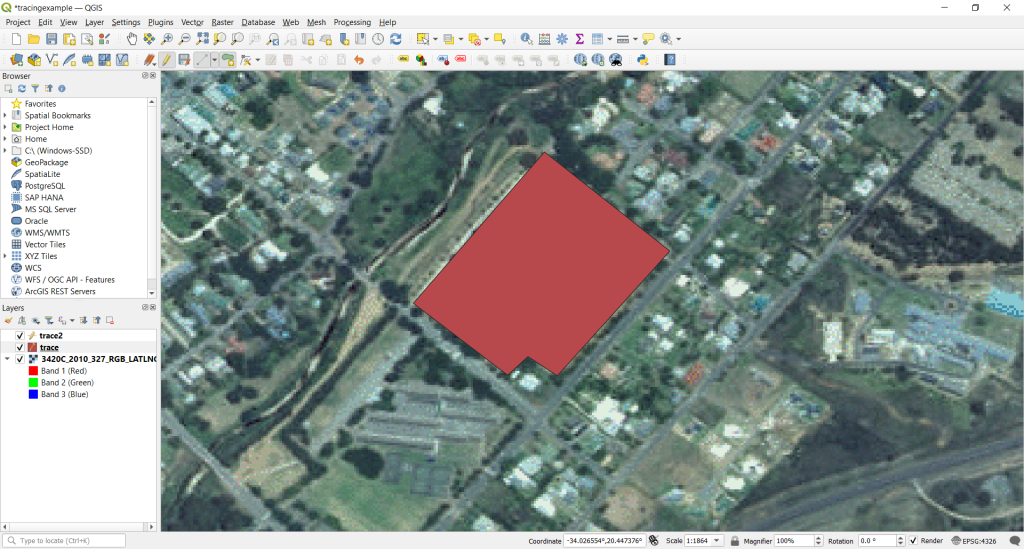
- For polygons, left click to create vertices along an area, and right click to stop. On the following popup, fill in the data and click OK, or click Cancel to try again.
- The outline of the polygon should now be filled in.
- Similarly, for lines, left-click to add successive points then right-click to stop and fill out the attributes popup.
- To edit already created lines or polygons, select the Vertex Editor (All Layers)
 tool from the toolbar, and right-click on the object you want to edit. The vertices of the object should show up in red.
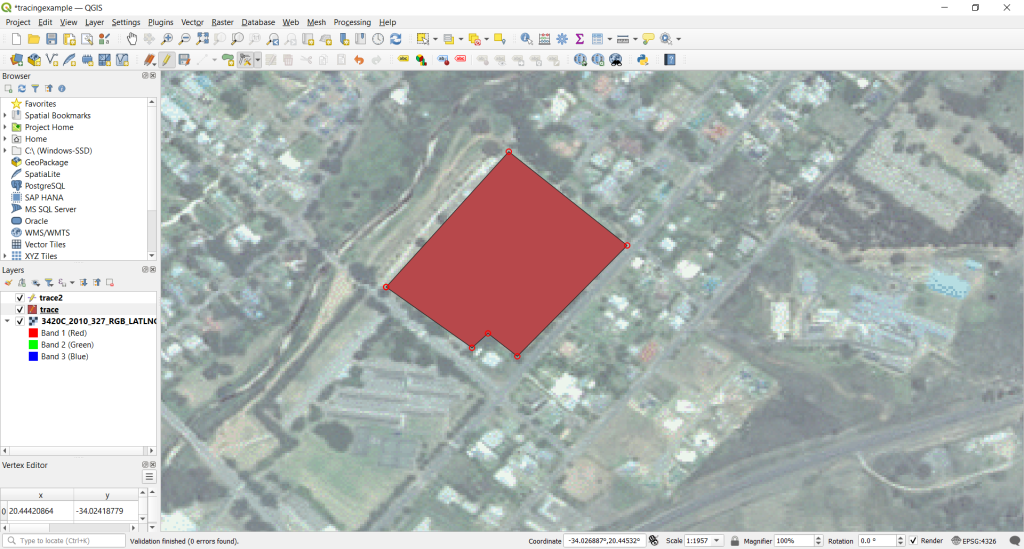
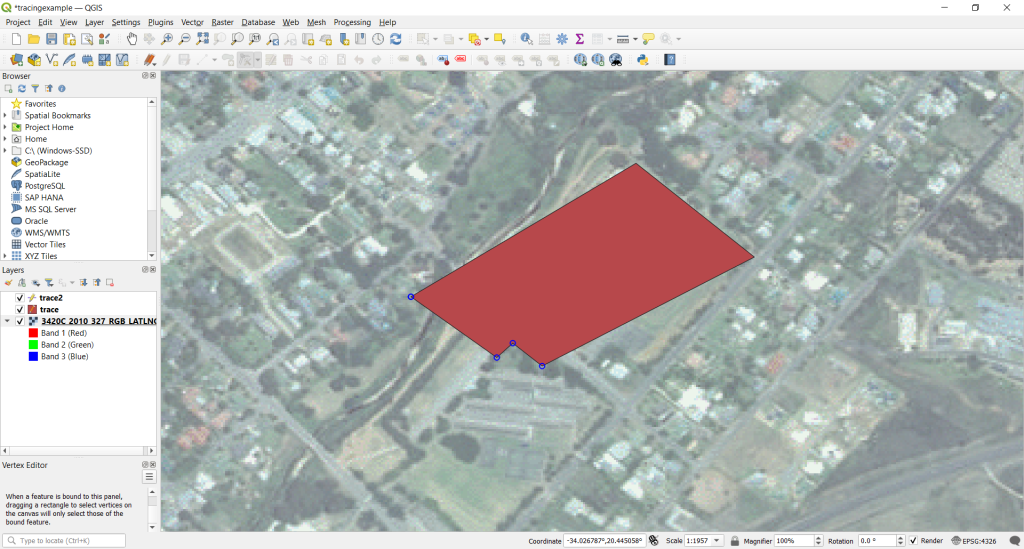
- You can click on a vertex to select it, or click and drag to select multiple. You can also hold Shift and click on multiple vertices to select them. The selected vertices will turn blue.
- Clicking on a selected vertex or one of the selected vertices and then clicking elsewhere will move all the selected vertices correspondingly.
- To add new vertices, click on the X at the midpoint of any segment between two lines and then click on the place you wish to place the new vertex.
- If you wish to cancel an unmade edit, right-click. Otherwise, you can click undo
 with the layer you are editing selected.
 - When you are done editing and adding shapes, click the Toggle Editing icon again to save and stop editing.
Georeferencing Raster Images
Some Preliminaries
Try to have your raster image aligned so that north faces upward. It would also be best if you already have the coordinates of specific points on your image, or at least some landmarks that you can reference.
If you have coordinates of specific points already, make sure you know what CRS those coordinates were defined in or else the georeferenced output will not be where you want it to be.
If you have landmarks, consider opening a satellite basemap (for example, by searching for “Satellite” in the QuickMapServices plugin) which come equipped with a CRS already so that you can easily identify points between your raster and the Earth (in that CRS).
Procedure
- Open the Georeferencer by clicking through Layer > Georeferencer in the menus.
- In the Georeferencer window, click on Open raster
 and select the raster image you want to georeference.
 - You can pan the map by middle-click and dragging, or by selecting the Pan
 tool. Making sure you have the Add Point
  tool selected, click on a point on the map in the Georeferencer window that you know the coordinates of, or that you can identify on your basemap.
 - A window should pop-up asking you to enter the coordinates of that point.
- If you have the coordinates already, enter them into the respective boxes and make sure to select the CRS that the coordinates are based in.
- If you are referencing with the basemap, click on “From Map Canvas”
 and then click on the corresponding point on your basemap.
- Click OK. Repeat for as many points as you can, but make sure to have at least 3 (more if there is significant distortion in your raster). If you mess up you can remove points with the Delete Point
 tool, or move them with the Move Point
  tool.
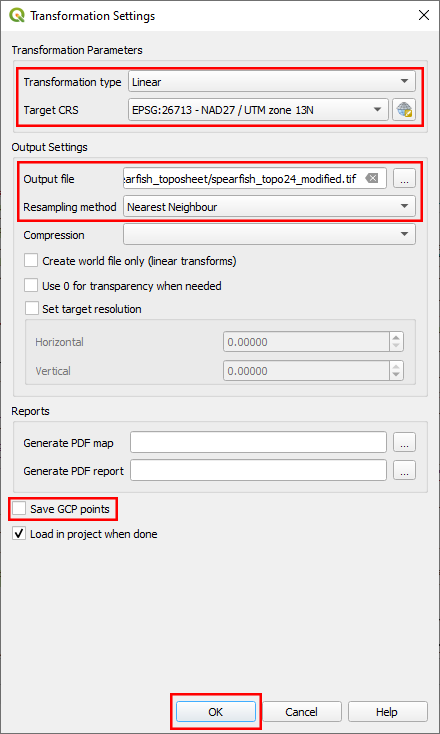
tool. - Then, click on the Transformation Settings
 button.
 - In the window that appears, select an appropriate Transformation type and Resampling method for your raster image (see here for more detailed information), then choose an output CRS and filename. You may also want to check to save GCP points so you do not need to redefine them if you want to redo the georeferencing. Click OK.
- Click on Start Georeferencing
 . When the process is complete, the georeferenced map will be loaded into QGIS. You can check to make sure that it is in the right location, and that it lines up properly by comparing it to a basemap. If the result is not satisfactory, you can try redoing the georeferencing with more points, or by changing the algorithm and resampling methods.
Joining External Data
To join an external data set to an existing layer in QGIS, say to a shapefile, you will need to have corresponding fields in both the data set and the shapefile to identify rows to be joined together. You may need to add some identifying fields to your files if you do not already have them.
- In QGIS, import both the external data set (e.g. a .csv file) and the shapefile you want to join the data to, either by dragging and dropping or by using the Data Source Manager .
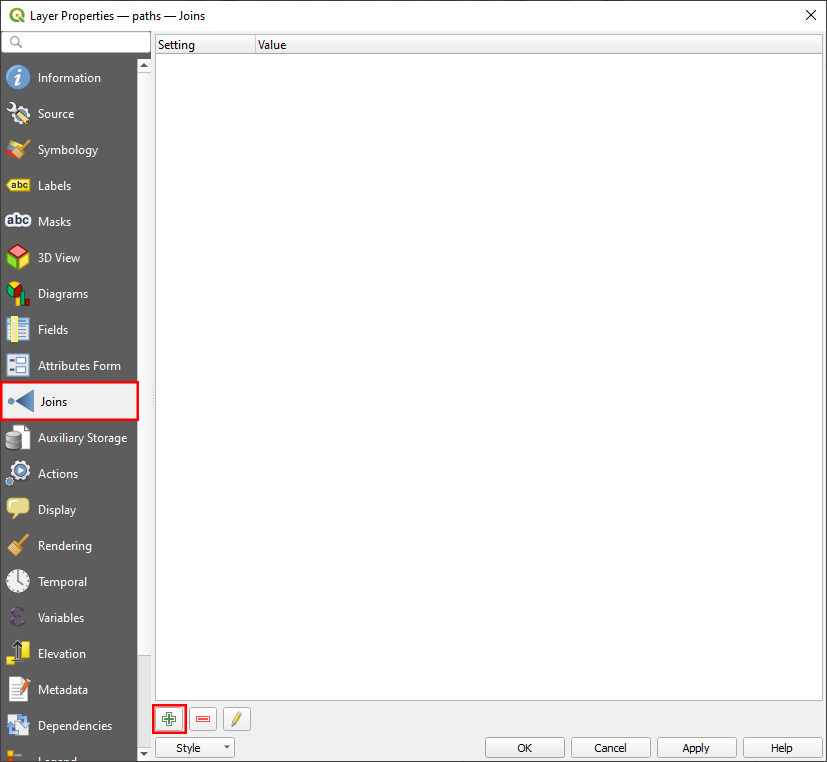
- Right-click on the shapefile’s layer and click on Properties to open the Properties window.
- In the window, click on the “Joins” tab in the left column, and then click on the Add new join button
 .
. 
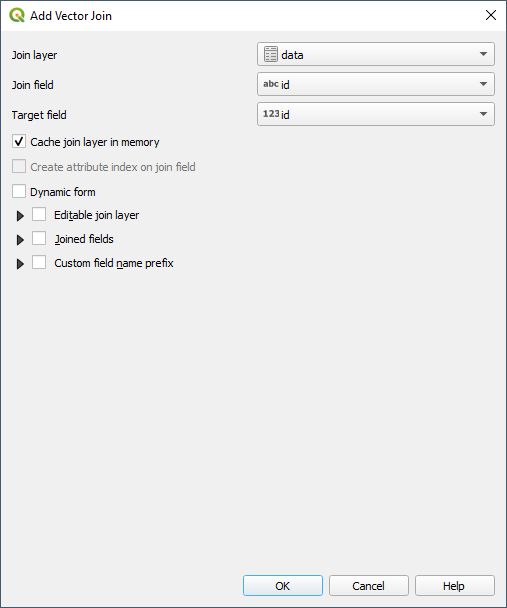
- In the Joins window that appears, select the layer with the data you want to join to the vector layer as the “Join layer”, and choose the “Join field” and “Target field” to be the appropriate fields that identify which rows should be joined together. By default, the join layer will join all fields from the data set to the shapefile, but if you only want to join a few specific layers, check the “Joined fields” box, and in the dropdown, select the fields you want to be added.
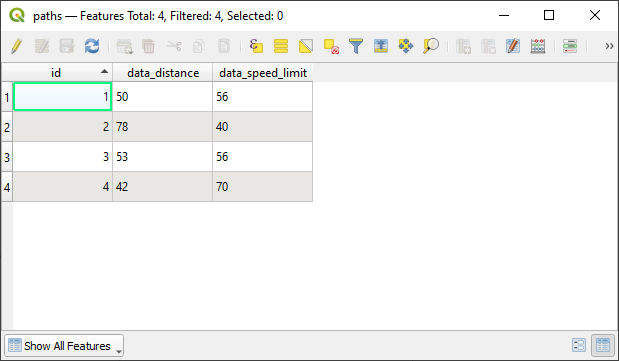
- Click OK when you are done and click OK again on the Properties window. If you right click on the shapefile layer and open the attribute table, you should see the newly joined fields added in. These fields will have a prefix corresponding to the name of the layer you joined them in from.
- If you wish to join more fields from other datasets, you can repeat the steps for each distinct dataset with fields you want to join.