
Changing Symbols Based on Fields
- Open the Layer Properties by right-clicking on the layer and clicking Properties.
- In the window, click “Symbology” on the left column. Then, click on the top dropdown box and select “Categorized”.
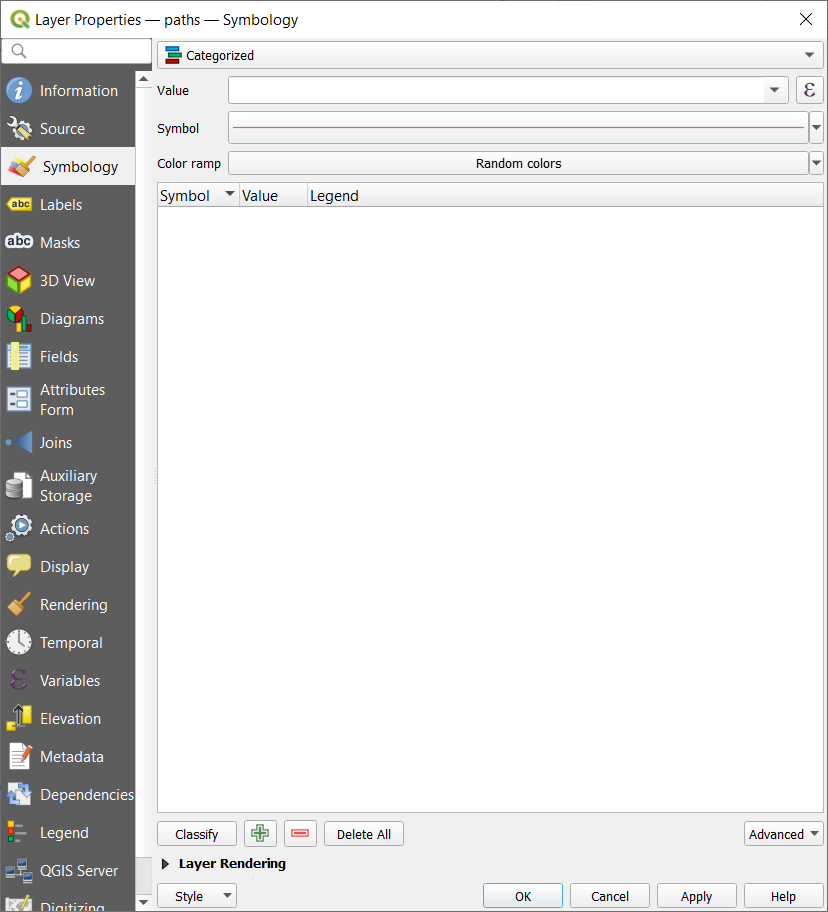
- In the Value box, click the triangle to open the dropdown box, and select the field you want to symbolize by. In this case, you will have distinct rules for each distinct field value (for example, if you are symbolizing by ids, each id would be assigned a unique color).
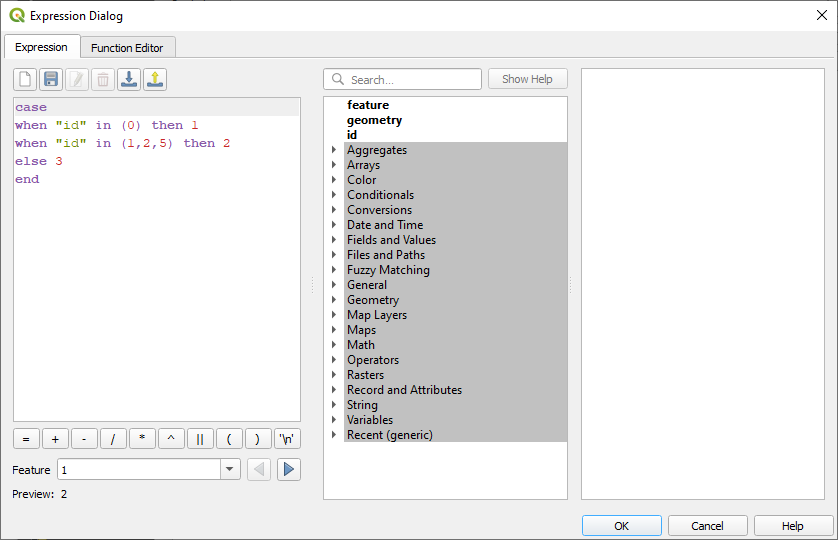
- To work with value ranges, you will need to use the Expression Editor
 to create custom values for each range:
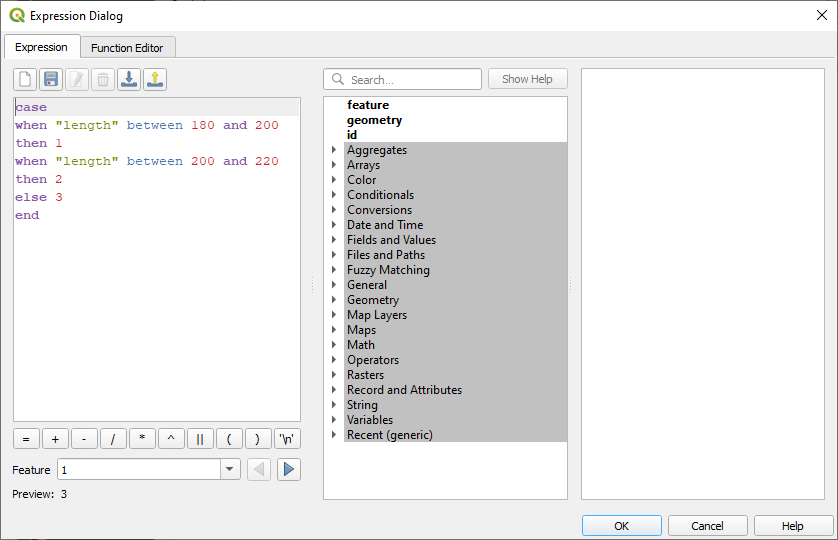
Coloring
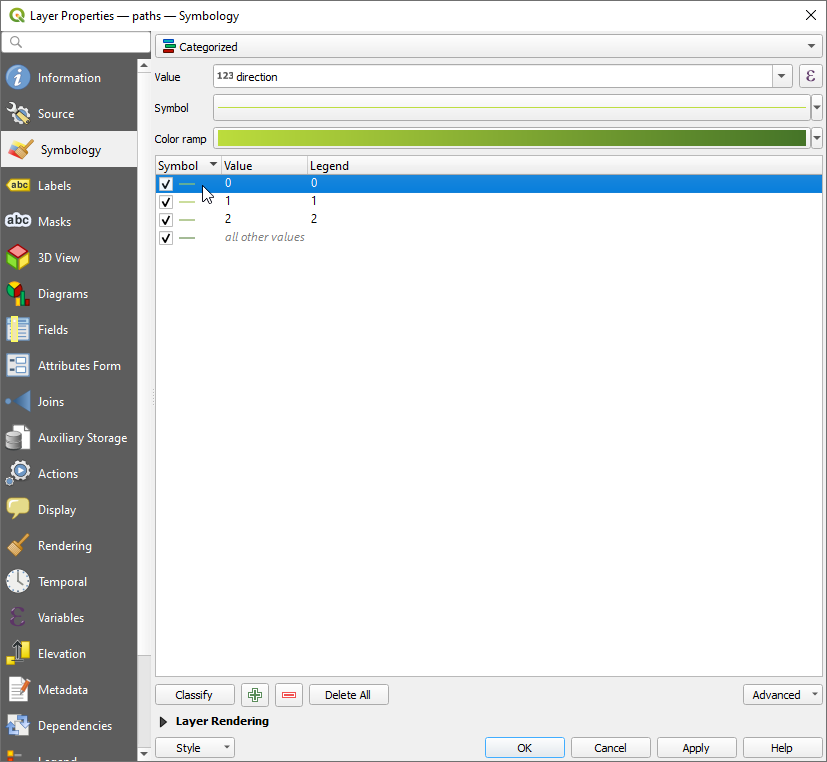
- Leave “Symbol” as is. To change how your elements will be colored, click on “Random colors” or the little triangle besides it to select a color ramp, or create your own.
- To edit the ramp, click on the block of color that replaced “Random colors” besides “Color ramp”. To change the way the colors are ordered, select “Invert Color Ramp” in the menu by clicking on the little triangle.
- Click Classify near the bottom left and QGIS will automatically pick the colors out for you based on your field.
- To manually edit a rule, double left-click on the rules’ row under “Symbol” to open up a dialog to edit it.
Marker Lines
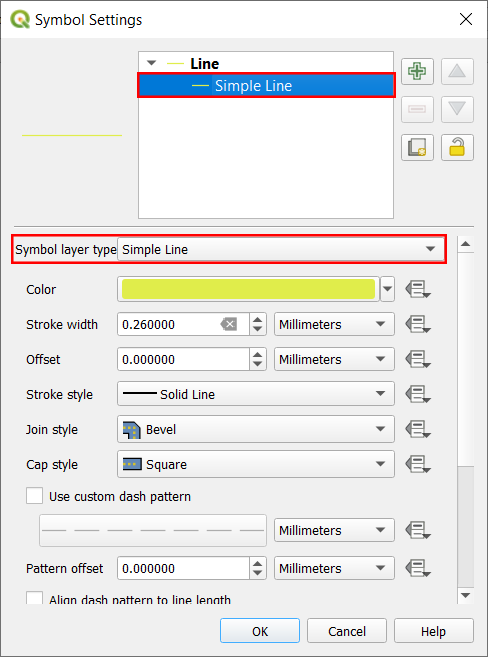
- To add Markers to your line, click on the box to the right of Symbol. A Symbol Settings window should pop up.

- At the top, click on the row that says “Simple Line.” The bottom part of the window should put up more options. Open the dropdown box besides “Symbol Layer Type” and select “Marker Line”.
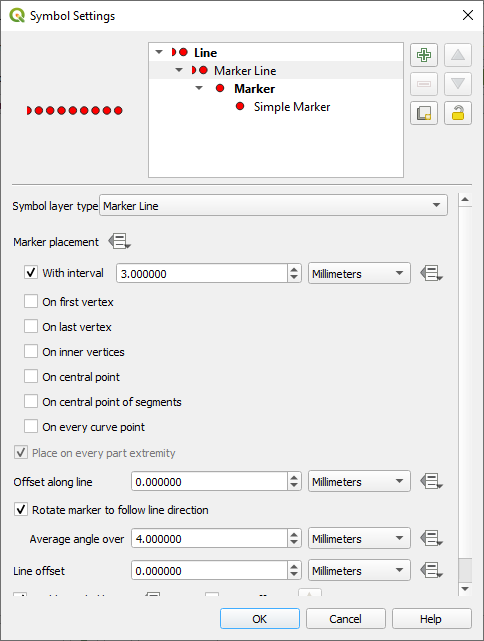
- The white box at the top of the window should now have more rows, and new options should replace the ones for the simple line. In particular, a “Marker Placement” option will allow you to change where markers are placed along your line.
- To change the symbol used as a marker or for other options related to single markers, click on the final row that says “Simple Marker”.
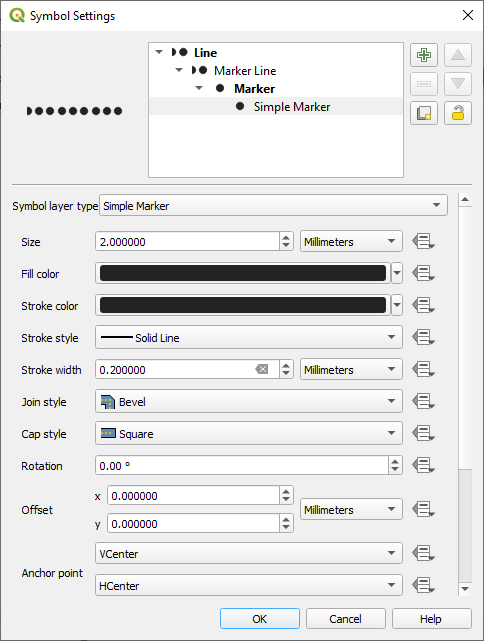
- Scrolling to the bottom, there is a list of shapes you can use as markers. Click on one to select it. You can also select a different Symbol layer type for different types of markers as needed.
- If you need the marker line or the markers to display differently depending on the value of the field, click on the Data defined override icon
 and click “Edit” to open the Expression Editor.
 - When you are done, click OK, and then click Classify. If you already have previous rules, you might be prompted if you want to delete your previous ones.
Adding Labels
- Open the Layer Properties window for the layer you want to label, as before.
- In the pop-up window, click on Labels in the leftmost column.
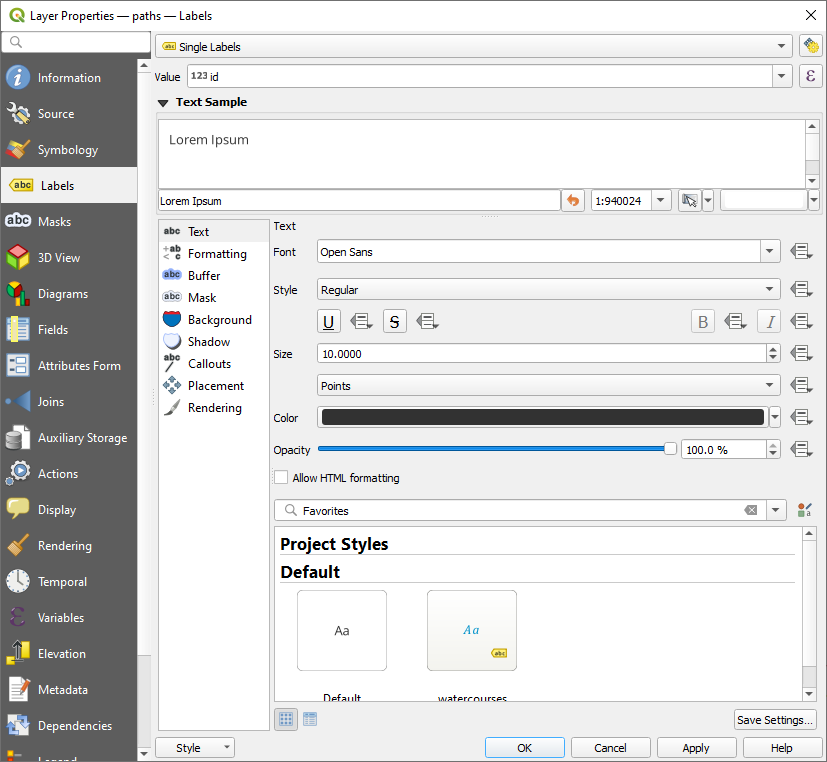
- Besides Value, use the dropdown box to select the field you want to label each object in the layer by, or alternatively use the expression editor .
- Change the font, style and other display settings as needed.
- If the label text is hard to see over the rest of the map, you can add a buffer around the label. Click on Buffer in the middle column, and then check Draw text buffer.
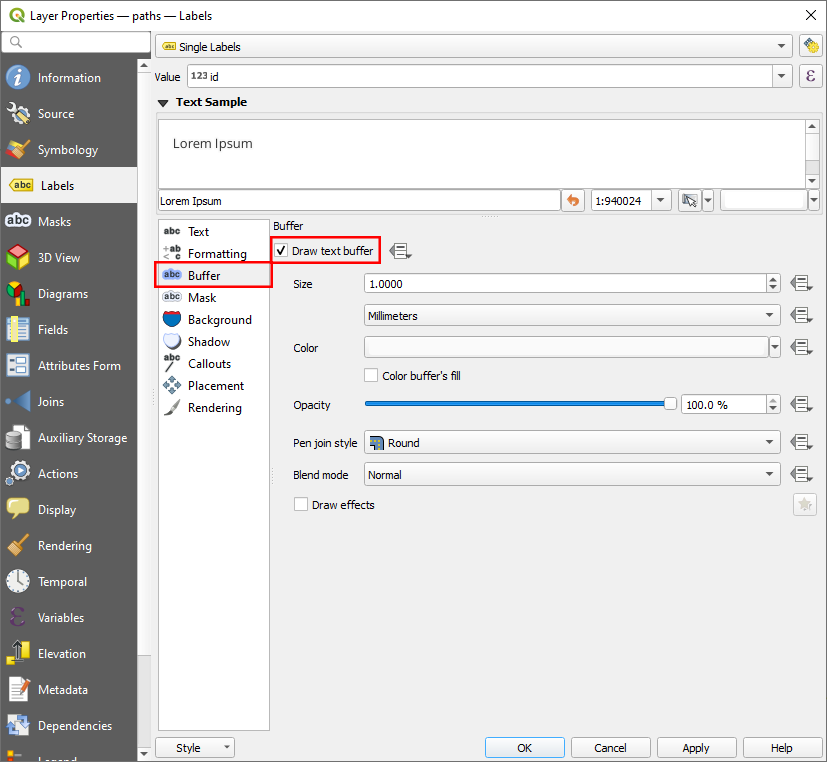
- Change the parameters until you are satisfied and then click Apply and OK.
Adding Buffers
For this section, it is important to have your vector layer CRS configured to one with meters as units, not latitude and longitude degrees. You may need to reproject your shapefiles and your project to do so (see here).
- Import your shapefile into QGIS if you have not already. Then, open the Processing Toolbox
 and navigate to the “Buffer” algorithm (listed under “Vector geometry”).
 - Double-click to open the Buffer dialog. In the window that opens, select the shapefile layer you want to create a buffer around under input layer. Change the distance to be how far out from each shape you want the buffer to include. Check the “Dissolve result” box if you want all of the buffers created for each distinct object to be combined into one object in the output layer. Click Run.
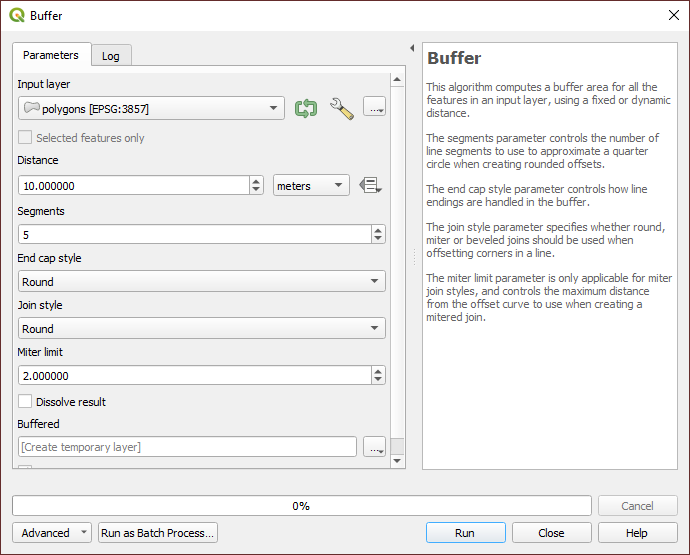
- If the end result has edges that are too choppy and are not smooth, you can try increasing the Segments parameter.